COVID - 19 DATA ANALYSIS GERMANY View

The following repository contains the Note book dealing with Covid 19 data analysis for the country Germany.

OBJECTIVE

  • The main goal of this note book is the analysise and predict the number of new cases for the country germnay in future days.
  • Obtain data insights using pandas.
  • Cleaning the data with appropriate techniques.
  • Performing epxloratory data analysis (EDA) on the data to get better insights.
  • Modeling the data with various model with appropriate feature selection techniques.
# Importing required libraries
import numpy  as np
import pandas as pd
import matplotlib.pyplot as plt
%matplotlib inline
import seaborn as sns
import datetime as dt
import warnings
warnings.filterwarnings("ignore")

Getting Germany Country data

# Filtering to Germany
grouplocation=df_data.groupby(df_data.location)
df_germany=grouplocation.get_group("Germany")
pd.set_option('display.max_columns', None)

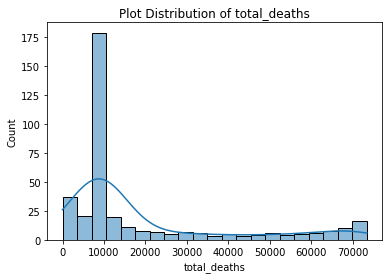
Checking Skewness Graphically

2ba98b21-8169-4d66-8927-caaeab4bce66 6361af52-3954-4f16-a59d-1d5d64e4faf4 7d9a3630-3e60-457e-8e3c-94c803187252 f80d92be-ac92-4fa2-9dfc-62930197722b eed683af-eb1c-4714-963c-dc6713067f6f a25afd88-d74c-4196-bec0-b7bd7be34e75 dd514b00-403a-45e8-ab47-2b916476ffa6 e3795e67-091d-44f5-8a20-fa0e81ce4539 53f05013-e700-43e1-bac1-82e123065907 68b26f06-9ce1-46e9-8b8a-fb4515f42221 dfb30a4c-78a9-45ee-855a-7905e1aa3bd2 ffde7dcd-d89f-4243-be72-b541c629f5ea 5cd8ff02-13fb-400e-bac6-8858b746e651 44e5322e-b87c-4bc1-891d-c8a9d2795270 7ef31a4a-7241-475f-8730-bddaf9750ef6 145e885c-cd20-4b68-9635-adc03883c2cb 9f5bd9cb-3c36-43d1-8eee-d605b45d8d5e 94dc4f44-bdb7-4f2d-8482-7d1de1033698 78558ac3-f7a5-4518-972f-5c6a35403ce6 f880a23a-a127-4680-bbf9-0f278f1d0cd6 76fac49d-bf7b-4f3c-b380-29093d91c936 ce6678c1-e916-4274-adbd-cd0f1a2ede08 24c2312e-d4c0-4aa7-bf57-bcc2265b696f be08e9b1-2153-4b9c-93dc-4d0d76bf26ca a0ff80a7-01bc-410b-aca7-88739707d5e5 4604f29d-9356-4256-9f82-b90093fb9a19 dbbdf1af-d802-4481-af9f-8175447d1761 1c099c38-4b85-4d50-af9f-0b948128ba97 06b522d8-b727-4d70-80d3-4cfe6b37297f

Total Number of Recovered Cases

6ae14b37-80e5-400c-affe-c56de189a276

b8602bcd-63b1-4ca9-b5f0-282cf1d31d31

793330a7-e6e7-4a50-9ba5-d9280f3a44f4

Total Number of Active Cases

f1de6484-fd25-4857-88cd-272dcb48f591

3d489bc9-a85f-4e79-83b1-51f5524297e9

Total Number of New Deaths

938400fb-86b7-41ad-aae4-15dca44d96ff

Correlation

Output

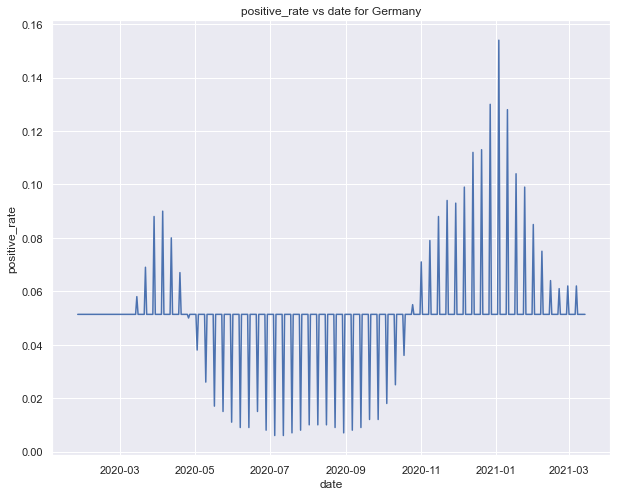
Line Plot gives the relation between how the each column vaires with respect to each Day.

5385d8b9-0f1e-4136-b363-6572f0f361b7 d2e880ee-8c8f-4d37-b7a4-559bddebdb6d 362d1d2d-6377-4867-8810-2ab34b8e5d5c 0cefa159-6bf2-4869-baa4-9f0726fd529e b351d79a-a213-4793-9c2c-97dc90a2f72c 90330589-b8e4-4c2a-8781-410cfe91dbea c45a1435-d7b4-4d4e-b102-292415a53ec3 f7fb8b58-34f1-4b28-a24b-0d47f822b448 b4dbe122-34a1-4f01-b183-2756f81311f3 7100ccf5-0438-4df4-a347-0098683e9679 af9c78e7-4459-48a3-9e74-fef5cf16b98e 9046ed84-a96f-48fe-ad78-a8fbb29f24d0 ff577dd2-46e4-4d31-a8f0-837263e71e99 d338864a-13fd-4ac2-8a48-d747aa97ba40 f2e409ef-0abd-44f0-839b-9cb2e8eed8e7 849fe06f-80e9-4b5a-be0c-67955acca559 79abbc8a-e4e2-4651-9fc6-b720fb403cc7 b0b5923d-5b59-4d33-ad06-aab1ed84e871 8db0d3cf-b665-4b17-8c12-9e74b98ecd92 9fbec232-c3d9-49e1-96a5-b5551bef9240 75a4551f-ab1f-47cf-baf8-8ad330dac6aa bcc0fc56-b09b-4253-949f-86dddbcc93d0 1dc22f3f-c7c8-4fde-b641-a95f0d147770 855cc624-2d0d-4b31-9873-3ebd023b262a a3817a98-40f2-4294-acc1-69727ac3e647 7676da8b-ed69-4a44-b392-7ce6c27189d1